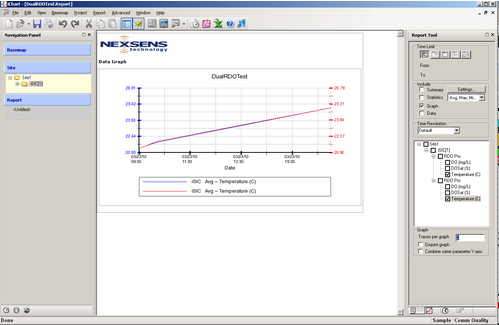
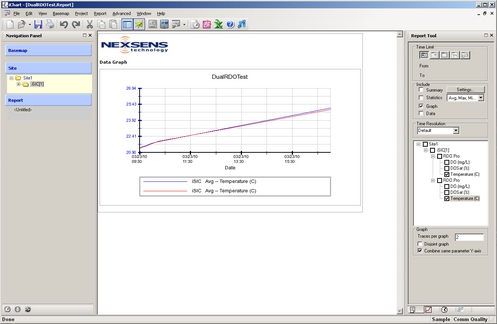
Graphing parameters on the same axis can be useful when comparing multiple graphs of the same parameter. These steps will provide instructions on how this can be achieved.
1. Open the Project File in iChart.
2. Open an existing report or create a new report by selecting Report | New Report.
3. Check parameters to be combined in the Report Tool.
4. Change the “traces per graph” box to the amount of parameters to be combined.

Figure 1: Combining graphs
5. Check the “combine same parameter Y-axis” box if only one Y-axis scale of the same parameter is desired.

Figure 2: Combining the same parameter Y-axis
6. Check the graphs to ensure that the desired result was achieved.
REV: 13G18
