Dissolved oxygen sensors, whether used as part of real-time monitoring systems or for quality assurance or spot sampling, provide immediate results, high accuracy and more convenience. Electrochemical and optical dissolved oxygen sensors are the most common types on the market. There are both galvanic and polarographic varieties of electrochemical DO sensors. Hydropower facilities usually use an optical sensor or a submerged rapid-pulsing sensor for their dissolved oxygen monitoring systems.
Electrochemical DO sensors
The primary benefit of electrochemical dissolved oxygen sensors is that they are very low cost DO sensors. Both polarographic and galvanic DO sensors isolate an anode and a cathode from the sample with a thin, semi-permeable membrane. The electrodes rest in an electrolyte solution and measure how fast dissolved oxygen gets consumed at the cathode after it diffuses across the membrane.
The drawback of these sensors is that they are flow dependent, relying on pressure to make the reaction work. This means in no-flow situations, electrochemical DO sensors can give you an artificially low level, so it’s important to stir these sensors in the sample until you’re sure the DO reading is not going up.
Optical DO sensors
Optical DO sensors have several components: a sensing element, a semi-permeable membrane, a photodetector, and a light-emitting diode (LED). In this kind of sensor, oxygen again crosses the membrane, but this time, the sensing element holds a luminescent dye that reacts when exposed to the LED. The intensity and brightness of the reaction depends on how much dissolved oxygen is in the water, and the photodetector calculates this value.
At low concentrations, the dissolved oxygen level in the water is inversely proportional to luminescence lifetime, the length of time the dye reacts with the light. The reaction is non-linear at high concentrations, however, and most meters with optical sensors deal with this when they’re measuring higher concentrations by modifying their internal algorithms.
There are many benefits to using optical DO sensors. First, they are more accurate on the whole than electrochemical sensors. This accuracy is enhanced by their membranes’ imperviousness to gases such as hydrogen sulfide that can permeate a membrane used in an electrochemical DO sensor. Optical sensors are also very accurate at very low concentrations.
Furthermore, thanks to low maintenance requirements, optical DO sensors are ideal for long-term monitoring. Unlike their electrochemical counterparts, they do not necessitate stirring under some conditions or require any warm-up time. They also hold a calibration for up to several months with little or no calibration drift.
Over extended periods of time, the dye used in these sensors degrades, and eventually, the membrane and sensing element will need to be replaced. However, these upkeep events are very infrequent compared to those associated with electrochemical sensors. Furthermore, because optical sensors that measure luminescence lifetime are less sensitive to dye degradation than are those that measure intensity, luminescence lifetime-measuring sensors stay accurate despite some photodegradation.
Polarographic DO sensors
Pulsing polarographic DO sensors turn on and off every few seconds, creating a flow dependence of almost zero as the dissolved oxygen replenishes at the cathode surface and membrane. This reduced flow dependence means there is no need to stir the water sample while using this sensor.
Typical DO monitoring systems
For most hydropower facilities, three monitoring stations meet the regulatory needs. One upstream station provides background data about the state of water in the ecosystem before impact from the facility. One station within the impoundment offers a risk analysis before the water is released. Finally, one downstream station at a location affected by the impoundment release is for confirming the safety of the released water.
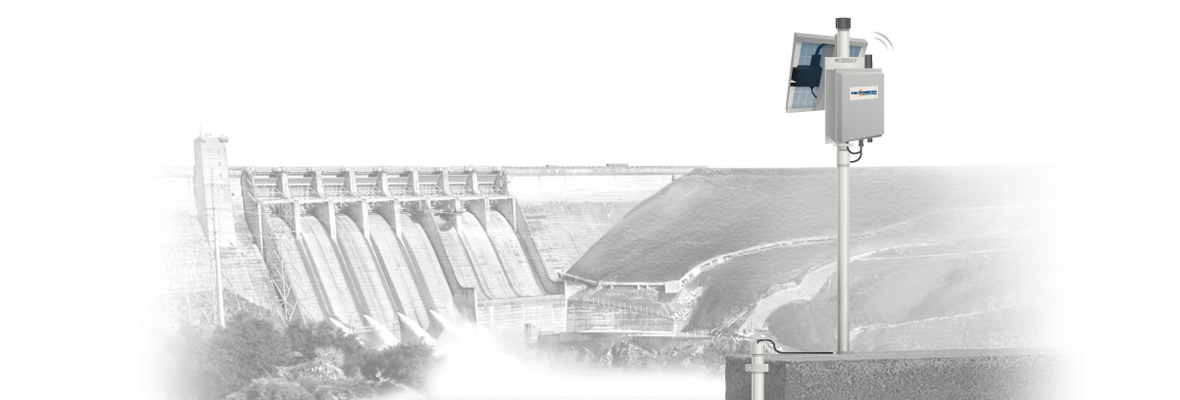
Dissolved oxygen monitoring data is most effective when provided in real-time, and an integrated telemetry system makes this possible. A data logger receives measurements from sensors at multiple depths, logging them at pre-defined intervals. Using telemetry, the system then transmits the data securely to the Internet in real-time.
Each integrated data logging and telemetry system can be customized for the hydropower facility in question, housing as many sensors as desired. A central battery powers the station, while a solar panel system ensures that it recharges, never losing power. Together, each piece of the station ensures a constant stream of data and a rapid response from the facility team.
Dissolved oxygen monitoring sites
There are different kinds of hydroelectric power facilities, but all hydropower dams generate electricity through amassing water and using its potential energy. The greater the depth, the more potential energy—and the more potential for stratification. Once water is released from the impoundment, it travels through the system, generating power.
At each real-time monitoring station, an integrated data logging system houses the data logger, the power supply/charging system, and the telemetry module. In most cases, integrated solar panels continuously charge the 12VDC battery. The data logger can be mounted to a pole or wall on the dam, alongside the river bank, or on structures in the river.
To protect the DO sensors in the water from debris, keep the equipment in place, and make calibration easier, PVC or metal deployment pipes are used. Each pipe is perforated close to the sensor, enabling sufficient water flow for measurement. The DO sensor itself can hang at multiple depths in the water column, so managers can identify stratification problems. The sensor can also be deployed in a multi-parameter sonde, or as a standalone tool.
Selecting the site location
Requirements for each hydroelectric facility are different. Mandatory monitoring locations can be upstream, downstream, and/or inside the impoundment. For accurate data, stationary DO monitoring stations should be mounted at fixed locations. Common locations for mounted DO monitoring systems include wall or pole mounting on the dam itself, or on nearby piers, bridges, railroad trestles, docks and other lock structures. To protect the system from vandalism and inclement weather, the unit can be enclosed in a stainless steel casing. The sensors, encased in a perforated metal or PVC pipe to protect them from debris and ensure quality data and easy removal, are fed from the station to the water.
To gather more comprehensive water-column data, it can be more effective to use a buoy-based system, which doesn’t rely on infrastructure and can support multiple sensors anywhere along the water column. Data buoys can provide a complete water quality profile of a reservoir from a stable platform that can be placed at any point in the waterway. Data buoys hold the same components as other stations—a solar-powered battery pack, a data logger, and telemetry—and come with a net buoyancy range between 150 to 450 pounds to offset equipment payload.
A two-point mooring is best for monitoring dissolved oxygen in a reservoir, because it avoids entanglement with anchor lines, offers more stability, and opens the water column below the data buoy for the sensors. Mooring hardware typically includes anchors, bottom chains, stainless steel mooring lines, and two marker buoys. Deploying the data buoy in the deepest part of the impoundment offers the most comprehensive water quality profile, providing multiple measurement depths and the best sense of the entire body of water’s characteristics as a whole.
Where water quality standards are not dictated by state or local authorities, upstream monitoring stations can provide background data. Monitoring stations inside the impoundment can simply monitor DO levels at the intake point, or they can monitor at various depths to provide stratification data. Downstream stations might be placed at the water release outlet, in the tailrace or stilling basin, after a weir, or downstream from the facility.
Intake point DO monitoring is required for some FERC license holders. This is typically done with a mounted telemetry system attached to some part of the dam’s structure. The sensor can then be positioned in the water at a set point, fixed.
When it comes to DO monitoring at hydroelectric plants, the hydropower outlet is the most important monitoring location. This is the point at which the facility releases oxygen-depleted water into the river, so it’s critical to know how much of an affect the release is likely to have on the rest of the aquatic system and whether mitigation measures should be implemented. Usually, these outlet-monitoring stations are mounted, although buoy-based outlet-monitoring is also possible.
Directly below the dam is a stilling basin, where spillway water is slowed and contained. This is an interesting locale for dissolved oxygen, because although most hydropower dam problems are related to dissolved oxygen levels that are too low, the opposite problem may plague the stilling basin, especially if the outlet is downstream. This basin is used to contain and slow down spillway water, which can cause gas bubble disease. Therefore, at many hydroelectric facilities, stilling basins have monitoring stations to ensure quality DO levels and protect against supersaturated water.
DO monitoring downstream will give you the data to understand any actual effects de-oxygenated water is having on the aquatic ecosystem. As opposed to relying on flow models based on intake/outlet data, downstream monitoring reveals the actual impacts of the hydropower facility. However, as they are further away, they will not allow for as quick of a mitigation response if levels are below the accepted minimum.
Before deploying any system, whether it’s buoy-based or stationary, it’s critical to calibrate all sensors prior to installation and regularly afterward to ensure accurate data. You should also assemble the platforms of a buoy-based system before deploying it. Finally, to ensure everything is functioning well and your team knows how to work with the equipment, test each component of your complete DO monitoring system, including data logger, sensors, software, and telemetry, before deploying them.
Data management and quality assurance
FERC compliance relies on not just collecting the right monitoring data, but also on reporting it. It is possible to measure and record data onsite manually, but it’s far more cost effective and convenient to use a telemetry system and data logger. This is even more important when there are adverse conditions that demand action; alerts from real-time data allow an immediate reaction and enable a faster response time.
Data loggers collect and store data from sondes and sensors, including multi-parameter sensors and temperature strings. Often, sondes can log their own data. However, a dedicated data logger can ensure that you don’t lose any data by collecting data from all attached sensors in a group. Data loggers with telemetry capability can then transmit the data to a central location in one of several ways—using radio, Ethernet, cellular modem or satellite modem. Solar power and rechargeable batteries can power data loggers in remote locations, or they can use an AC converter.
Telemetry, or wireless communication, allows users to monitor DO, and water quality above and below the facility, in real-time. Typical telemetry options use cellular although satellite telemetry is also possible in more remote locations. The most cost-effective option for telemetry will be determined by the distance from a project computer and local site conditions.
Radio telemetry is best when all equipment is nearby. A license-free spread-spectrum radio can usually communicate with a data logger on the shore or the side of a dam. For a slightly longer range of about five miles in the line of sight or several hundred feet outside the line of sight, spread-spectrum radio is an option.
Cellular telemetry is more flexible because it works anywhere you can get a cellular signal. It is also slightly more costly, in that it requires a cellular data plan. However, cellular telemetry allows you to monitor for DO from various stations that are not in close proximity, without a base station, because each data logger can simply send its data to one central location which you can access remotely.
In very remote places where neither of the other telemetry options are feasible, satellite telemetry is still possible. A cross-linked, dynamic network of Low Earth Orbiting (LEO) satellites maintained by the Iridium communications network offers worldwide coverage for all data loggers with an Iridium satellite modem.
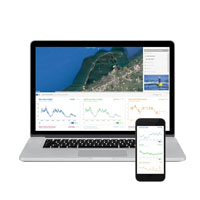
Once you’ve transmitted your data to a central location, a web-based datacenter becomes the most convenient way to view and share your monitoring data. Such a center provides you with instant online access to your data, 24/7, from any web browser, along with recent and historical data, dynamic area maps and weather information, statistical summaries, time series graphs, and various interactive tools for understanding and working with the data. Many cloud-based data centers can also be programmed to notify your team automatically when DO levels fall below set limits.
The bottom line
Monitoring dissolved oxygen levels is a key task for any hydroelectric facility. Getting the data on DO in real-time allows for a quick, responsive mitigation plan and a more effective solution to any problems arising from under-aerated water.
Equipment
The X3 data logger offers the latest in real-time monitoring technology with wireless communication, a large plug-and-play sensor library, and ultra-low power consumption.
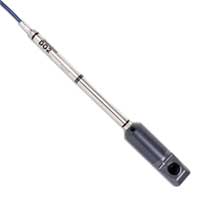
Seametrics’ DO2 is an optical dissolved oxygen sensor with built-in data logger for unattended DO monitoring applications.
WQData LIVE is a web-based project management service that allows users 24/7 instant access to data collected from remote telemetry systems.


0 comments