This handbook provides a comprehensive guide to modern techniques in measuring the natural environment, including water quality, hydrology, weather, and soil. It focuses on environmental monitoring and data collection, including sensors, remote data acquisition systems, and cloud-based data management. Its aim is to be a practical resource for environmental professionals, researchers, and students to quickly locate relevant and up-to-date information on best practices for designing, installing, and maintaining environmental measurement systems.
Environmental Measurement History
Environmental monitoring dates as far back as ancient civilizations. Early efforts at environmental observation were primarily qualitative, relying on human senses to track weather patterns, soil conditions, and water levels.

The Nilometer on Roda Island at Cairo, Egypt, was built in 861 AD to measure the river’s seasonal rise and fall. Too little water presaged famine while too much meant flooding. (Credit: David Stanley via Flickr CC BY 2.0)
Evidence of basic instrumentation has been discovered dating back thousands of years. In ancient Egypt, where annual flooding of the Nile River was essential to the agriculture that supported the civilization, the Egyptians built shafts called nilometers to measure water level and clarity. This allowed them to gauge the amount of nutrient-rich sediment the river would deposit on the floodplain, helping predict the productivity of the upcoming growing season.
The Romans famously developed hydraulic systems throughout the Roman Empire that were complex for their time, including aqueducts and baths. They even devised a rough method for calculating discharge based on pipe areas in order to charge fees for water distribution.1
With the rise of nautical exploration during the Age of Discovery from the 15th to 17th centuries, interest in more precise measurement of wind and water currents also emerged. Rudimentary physical observation techniques like placing floating objects in the water to estimate currents began to become more standardized.
The term “knots” comes from a 17th-century method of placing a pie-shaped piece of wood called a common log in the water with a knotted rope attached. Sailors would let the log float freely for a specific amount of time, and then count how many knots of the rope were in the water to estimate their speed.2

It was also during this period that English astronomer and physicist Edmund Halley published his map of global trade winds.3
The 17th century began to bring standardization into meteorological measurements as well. Italian scientist Evangelista Torricelli invented the first barometer in 1643, which used mercury in a tube to measure air pressure4. German scientist Daniel Gabriel Fahrenheit followed this with the mercury-in-glass thermometer for temperature measurement in 1714.5

Three major temperature scales: Celsius, kelvin and Fahrenheit with their respective boiling points, freezing points and absolute zero points. (Credit: Emeka Udenze via Wikimedia Commons CC 1.0 UNIVERSAL)
The accompanying Fahrenheit temperature scale is still in use today, though it has largely been displaced in scientific contexts by the Celsius scale, first developed by the Swedish astronomer Anders Celsius in 1742.6 The Kelvin scale, proposed in 1848 by William Thomson, also known as Lord Kelvin, is also used in scientific applications. It is an absolute temperature scale based on the concept of absolute zero, the theoretical point at which all molecular motion ceases.7
Further advancements in the Industrial Revolution of the 18th and 19th centuries introduced manufactured devices with mechanical components. This led to improvements in sensors for the measurement of parameters like wind and water currents. Though various anemometer designs had previously been conceived for wind measurements, Irish physicist Thomas Romney Robinson’s 4-cup anemometer invented in 1846 represented a significant improvement.3 Cup anemometers are still commonly used today.
While each successive improvement in meteorological measurements aided weather prediction and agricultural practices, the early 20th century saw further developments in soil science. In 1909, Danish chemist Søren Sørensen introduced the concept of pH, which helped to formalize acidity as a critical parameter for assessing soil conditions.
The concept of the tensiometer was developed later in the 1930s as scientists sought more accurate methods to measure the water content of the soil and its availability to plants. In the same decade, mechanical penetrometers were put into use to measure soil compaction, texture, and density.9
Electrification of Sensors
The introduction of electrical components into sensing devices was a critical step from observational techniques toward true monitoring systems. The study of electricity was a topic of great interest and excitement throughout the 19th century that led to many advances.
One development particularly relevant to environmental measurements was the resistance temperature detector (RTD), which measures temperature by observing the change in electrical resistance of a wire as its temperature changes.
The first practical RTD was invented by Sir William Siemens in 1871. He proposed platinum for its chemical inertness and because it has a stable resistance-temperature relationship that is well-defined and reproducible.10 Platinum RTDs are still widely used today, given their high accuracy, stability, and wide temperature range capabilities.
The early 20th century brought further advancements and saw significant progress in electrochemical sensors, devices that measure specific chemical properties through the interaction of a target substance with an electrode.
One notable example is the development of the pH electrode, which became an essential tool for measuring the acidity or alkalinity of solutions, including soil and water. The glass electrode for pH measurement was introduced in the 1920s and rapidly became standard due to its accuracy and reliability.11
Another landmark achievement in water quality measurement came in 1956 with the invention of the Clark dissolved oxygen electrode by Leland C. Clark. The Clark electrode operates based on the diffusion of oxygen through a permeable membrane to an electrode, where it is reduced, generating a measurable current.12 Although optical technology is most common for dissolved oxygen measurement today, membrane-style sensors are still in use.
This technology, along with other water quality sensor advancements, became crucial for monitoring aquatic health and industrial water treatment processes. Instrument manufacturers began looking at ways to combine multiple measurement parameters in a single package, and the 1970s and 1980s brought about early examples of the multi-parameter water quality sonde. Also known as multi-probes, these instruments integrated sensors for various parameters such as pH, dissolved oxygen, conductivity, turbidity, and temperature into a single, compact unit.
Around the same time, acoustic technology was emerging for water current measurement. Electromagnetic current meters had been invented a couple of decades prior, but the Acoustic Doppler Current Profiler (ADCP) advanced the field with acoustic technology based on the Doppler effect to profile currents at multiple depths in the water column simultaneously.
Data Logging and Computing
As sensor technology improved, so too did computing and data logging. The advent of microprocessors and digital technology in the mid-20th century revolutionized environmental monitoring.
Measurement systems like automated weather stations equipped with various sensors could now continuously collect data with minimal human intervention. Data loggers were developed to store large volumes of information over extended periods, facilitating long-term environmental studies.13
In the 1980s and 1990s, the introduction of personal computers and advancements in software enabled more sophisticated data analysis and modeling. Environmental scientists could now process vast amounts of data quickly and accurately, leading to improved predictions and understanding of environmental phenomena.
Real-Time Monitoring
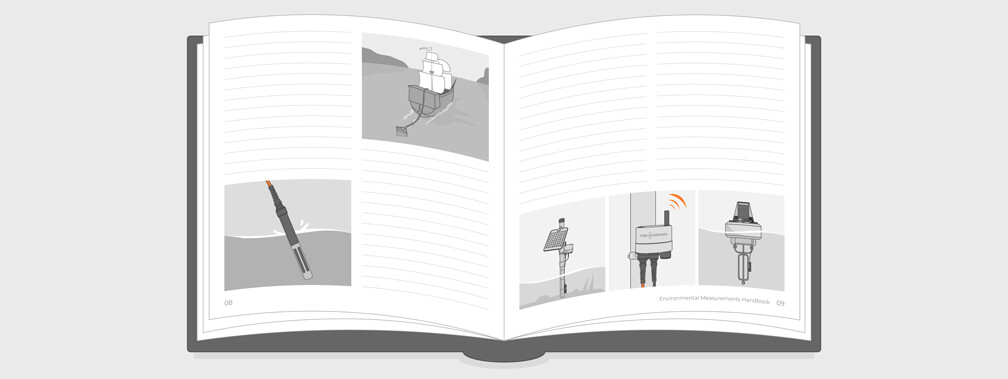
As the 21st century approached, the rise of data telemetry marked a new era in environmental monitoring. Sensors could now be connected to data logging systems equipped with wireless technologies like satellite, radio frequency (RF), and cellular communications. This allowed for real-time data acquisition even from remote and inaccessible monitoring sites.
Real-time monitoring systems are now widely used in a variety of applications, including weather forecasting, water quality monitoring, air quality assessment, soil monitoring, disaster response, and many others.
The integration of these systems with cloud computing and Internet of Things (IoT) platforms has further enhanced data accessibility and processing capabilities, allowing for advanced analytics and more informed environmental management. Smartphone apps facilitate the setup of instruments, system integration, and data visualization.
Going Forward
The rapidly evolving technological landscape continues to bring about new developments in environmental monitoring. Sensors and electronics are becoming smaller and more efficient, affordable and reliable, enabling more wide-scale distribution in even the most challenging environments. Machine learning and artificial intelligence are now being leveraged to analyze vast datasets, providing deeper insights and predictive capabilities.
As environmental monitoring technologies continue to advance, they promise to further enhance our ability to monitor and protect the environment, contributing to more sustainable and informed decision-making.
Resources
- Ruff, J.F. (2007). Flow Measurement: History. In Encyclopedia of Water Science (2nd Ed.). Boca Raton, FL: CRC Press, Inc.
- NOAA. What is the difference between a nautical mile and a knot? National Ocean Service website, https://oceanservice.noaa.gov/facts/nautical-mile-knot.html, 01/20/23.
- Halley E. (1686), “An Historical Account of the Trade Winds, and Monsoons, Observable in the Seas between and Near the Tropicks, with an Attempt to Assign the Phisical Cause of the Said Winds”, Philosophical Transactions, 16:153–168 doi:10.1098/rstl.1686.0026
- Middleton, W.E.K. (1964). The History of the Barometer. Baltimore: Johns Hopkins Press.
- Frisinger, H.H. (1983). “The History of Meteorology to 1800”. Bulletin of the American Meteorological Society, 64(7), pp. 755-761.
- Anderson, H.L. (1985). “The history of the thermometer and its use in meteorology”. Baltimore: Johns Hopkins University Press.
- Chang, H. (2004). Inventing Temperature: Measurement and Scientific Progress. Oxford University Press.
- Sparks, D.L. (2003). Environmental Soil Chemistry. San Diego, CA: Academic Press.
- Gardner, W.R. (1986). “Water Content,” in Methods of Soil Analysis: Part 1—Physical and Mineralogical Methods, edited by A. Klute. Madison, WI: American Society of Agronomy, Soil Science Society of America.
- Day, Lance, and Ian McNeil, eds. (1996). Biographical Dictionary of the History of Technology. New York: Routledge.
- Bard, Allen J., and Larry R. Faulkner. (2001). Electrochemical Methods: Fundamentals and Applications. New York: Wiley.
- Clark, L.C. Jr., and Lyons, C. (1962). “Electrode Systems for Continuous Monitoring in Cardiovascular Surgery.” Annals of the New York Academy of Sciences, 102(1), 29-45.
- Matthias, S.A., & Jones, H.G. (2003). Data Loggers and Data Acquisition Systems in Environmental Monitoring. International Journal of Environmental Monitoring and Assessment, 89(1), 23-40.