The following procedure was tested using PostgreSQL 9.3.2-3 (Windows) with psqlODBC (32bit) v09.02.0100-1 driver (ANSI).
1. Open iChart and select Help | About iChart. Verify that the iChart version is 6.16.030 or later. If not, update iChart to the latest version before continuing.
2. Close iChart.
3. Open Windows Explorer and navigate to the folder where iChart is installed. By default, it is in C:\Program Files\NexSens\iChart6 on 32-bit Windows or C:\Program Files (x86)\NexSens\iChart6 on 64-bit Windows.
4. Open the iChart.ini file using Notepad.
5. Search for the section with heading [ODBC].
6. Look for the GenericAutoIncrement= line and replace it with the following:
GenericAutoIncrement=SERIAL
7. Look for the DateTimeDataType= line and replace it with the following
DateTimeDataType=TIMESTAMP
Note: If timezone is desired, replace with the following line instead:
DateTimeDataType=”TIMESTAMP WITH TIME ZONE”
The following setup is optional:
8. To change char data type from fixed width to variable width, look for the CharDataType=char line and replace with:
CharDataType=varchar
9. Save the iChart.ini file and close Notepad.
10. Create an empty PostgreSQL database.
11. Using Windows ODBC manager, define an ODBC connection to the PostgreSQL database just created.
12. Start iChart.
13. Open the .icr project file.
14. Select Project | ODBC | Setup Database…
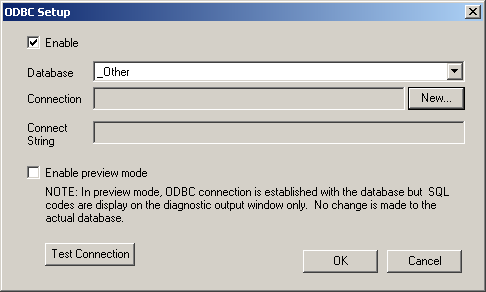
15. In the “ODBC Setup” dialog, check the Enable box and select _Other for Database.

Figure 1: ODBC Setup Dialog
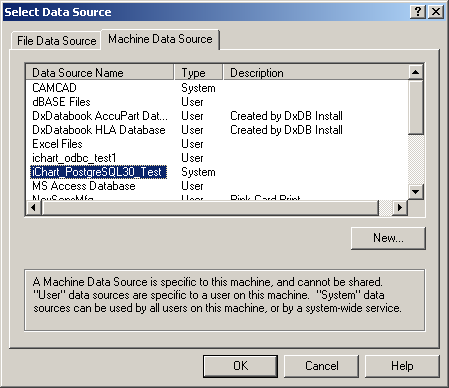
16. Click the New… button and select the ODBC connection defined in step 11.

Figure 2: Select Data Source Dialog
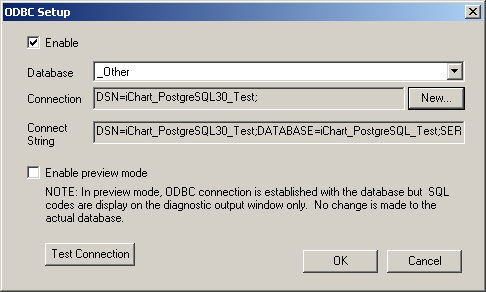
17. Click Test Connection to make sure that iChart can connect to the database.

Figure 3: Test Connection
18. Click OK.
19. At this point, iChart will create the following tables in the specified database:
_DevDir, _DevDesc, _DevNote, _DevData_1 to _DevData_n (one for each data logger)
Check the diagnostic output window (View | Diagnostic Window) and make sure there are no error messages.
REV: 14B14
