T-Node FR Temperature Sensor
Features
Tech Specs
Range: 0 to 45 C (32 to 113 F)
Accuracy: +/-0.075 C
Resolution: 0.01 C
T90 Response Time: 60 seconds
Refresh Rate: 2 seconds
Maximum Sensors: 250
Maximum Length: 1219m (4000 ft.)
Communications: RS-485 Modbus RTU
Power Requirement: 4-28 VDC
Current Draw Per Node: 1.65mA active; 1.45mA idle; 0.04mA sleep
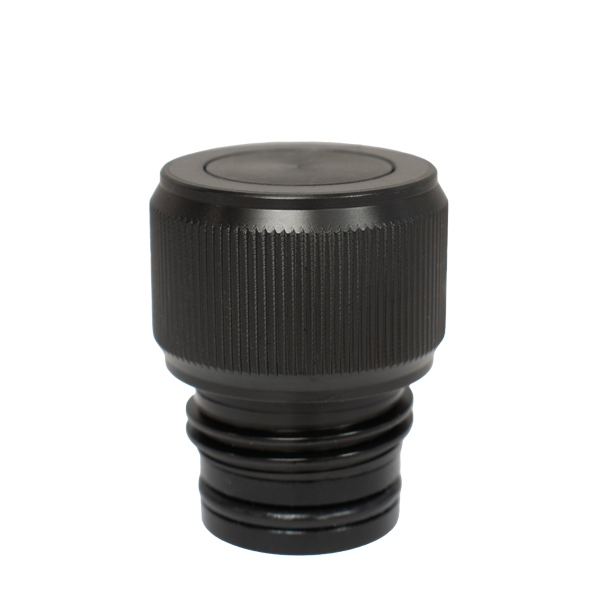
Connection Seal: Double o-ring, gland and face seal
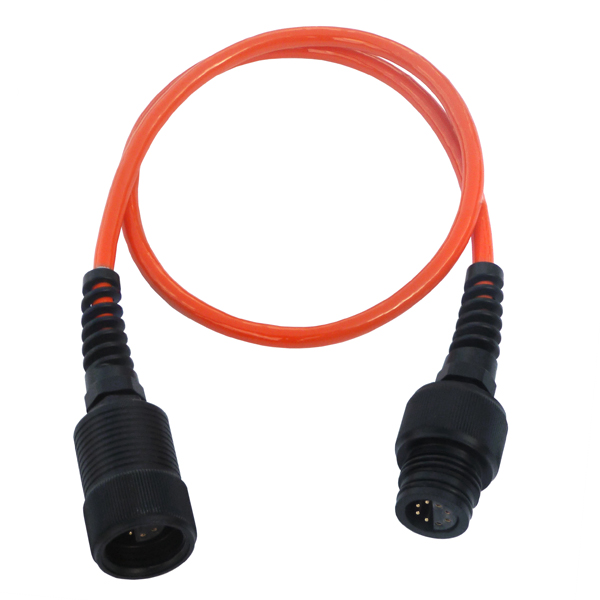
Connector: 8 pin, sensorBUS
Dimensions: 13.46cm L x 3.56cm Dia. (5.3" L x 1.4" Dia.)


Q&A


Get Started
Need help designing an Environmental IoT system? NexSens applications scientists will help you design the perfect monitoring system to meet field conditions and monitoring needs.
Accessories
Case Studies
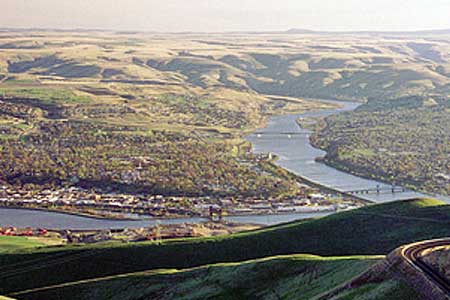
Washington Reservoir Temperature Changes
There are many major rivers flowing through the Pacific Northwest. Like others around the country, they are outfitted with various dams and reservoirs that are used to control their movements, provide energy and maintain drinking water supplies for those living around them.The U.S. Army Corps of Engineers (USACE) plays a big hand in managing and maintaining the structures that corral these rivers. Of significance for engineers with the USACE’s Walla Walla District are the Columbia, Snake and North Fork Clearwater Rivers.Along these waterways, engineers with the district oversee conditions in reservoirs that are linked to summer releases of dams. Typical impacts that managers see have to do with fluctuations in water temperatures, which can affect the aquatic life, like fish, that live downstream.
Eastern Lake Erie Dynamics
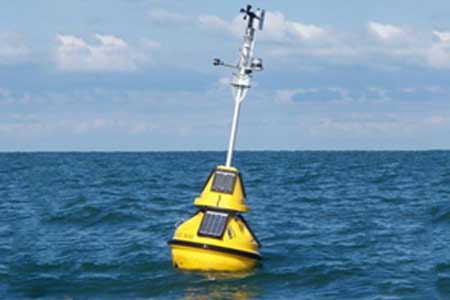
Lake Erie’s western basin has received a lot of attention in recent years, as it has hosted large and toxic algal blooms that seem to come every summer. But there are still plenty of valuable environmental data to be gleaned from studying in the lake’s deeper and less algae-prone eastern basin.Researchers at Buffalo State University know the value of monitoring in this basin firsthand, as they have maintained a data buoy in eastern Lake Erie since 2011. It was launched with support from the Great Lakes Observing System near Dunkirk, New York.The buoy provides meteorological and water quality information specific to its offshore area. When considered as part of the Great Lakes Observing System, its data can also be used on a broader scale in modeling lake currents, nutrient dynamics and even climatic changes.
Jordan Pond Clarity Tracking
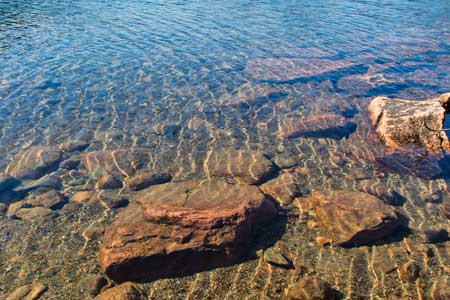
Jordan Pond is one of the most transparent lakes in Maine, but the water body has seen cloudier waters in recent years. Declines in clarity began back in the 1990s and the drops appeared to accelerate, with monitoring by the National Park Service charting a 2-meter drop in Secchi disk readings there from 1999 to 2014.Several hypotheses were put forth for the lake’s loss in clarity. Scientists suspected that decreases in acid rainfall from Clean Air Act regulations were involved. As less acid was deposited, they believed, the ionic strength of soils in the surrounding watershed went down, which could have contributed to rising levels of dissolved organic matter. Researchers also surmised that more frequent and intense rain storms in the region could have contributed to the uptick.To learn more about the lake’s changes, the University of Maine, Acadia National Park, and the non-profit Friends of Acadia group launched a data buoy equipped with a suite of sensors for monitoring conductivity, pH, dissolved oxygen, blue-green algae, photosynthetically active radiation, temperature and chlorophyll. Canon U.S.A. provided funding for the effort.


