


How to Configure a Stream-Side Water Quality Monitoring System

Recommended Stream and River Monitoring System
Monitoring water quality in streams and rivers provides critical insight into ecological health, pollution events, and seasonal trends. Integrated systems can be deployed from bridges, banks, culverts, trees, masts or other structures to collect continuous data.
Data Logger
The X3 environmental data logger is built for field deployment in harsh environments. Waterproof sensor ports, internal power management, and wireless telemetry simplify installation and ensure dependable, long-term operation.
Water Quality Sensors
Key parameters, including water temperature, conductivity, pH, turbidity, dissolved oxygen, algae, and nutrient concentrations, can be delivered in compact devices like the YSI EXO Multi-Parameter Water Quality Sonde and other similar instruments.
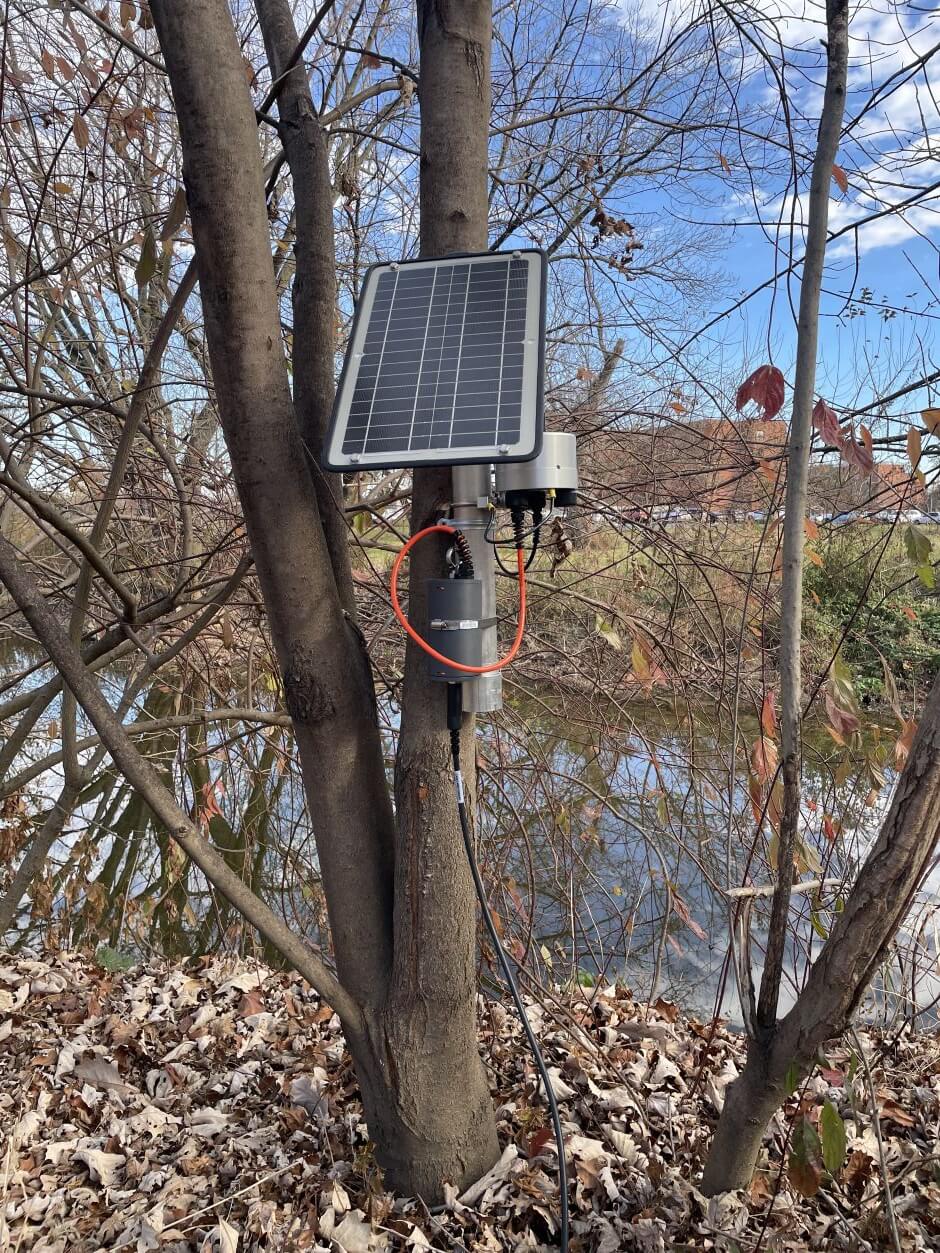
Power
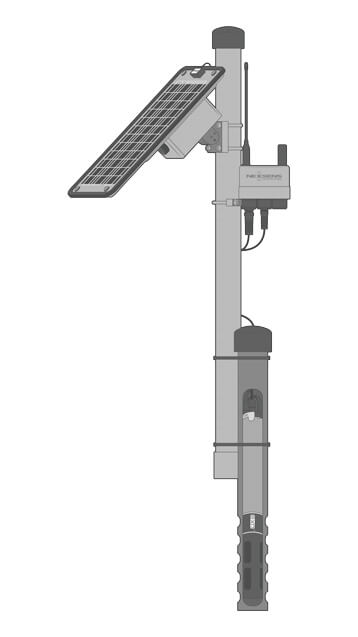
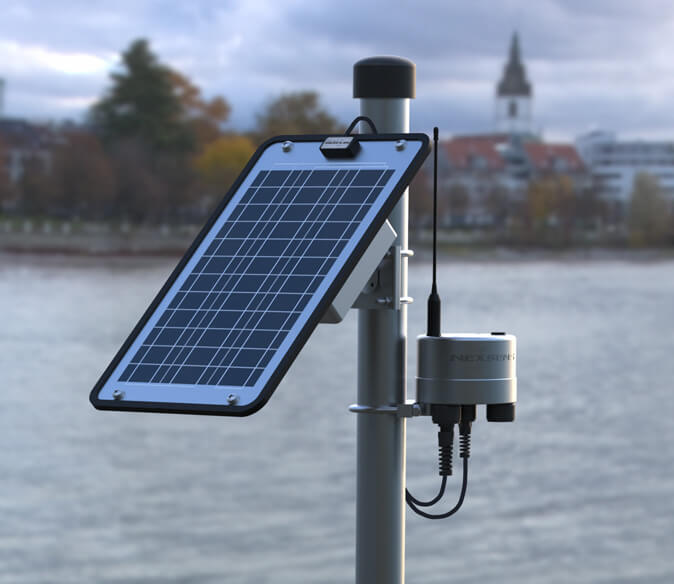
Systems are operated from a fixed power supply or solar-charged SP-series power packs for monitoring in remote locations. Solar panel and battery size are determined through analysis of total system power demand and regional sunlight conditions.


Need More?
From trickling streams to roaring rivers, every stream and river monitoring application presents a unique set of demands. NexSens monitoring systems are up to the task with the flexibility required to accurately measure water quality and beyond.
Integration Flexibility
The open integration capabilities of the X3 logger allow for integration of most common water quality sensors and multi-parameter sondes from leading manufacturers, including YSI, In-Situ, Eureka, Proteus, TriOS, Sea-Bird Scientific, and Seametrics.
Additional Sensors
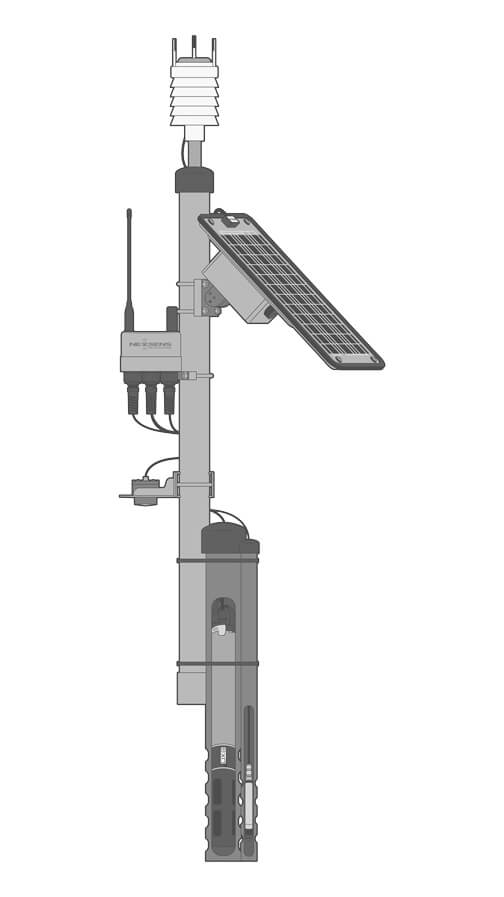
Complementary instruments such as rain gauges and multi-parameter weather stations allow for correlations between various parameters to be identified. Water level measurement can be added to most water quality sondes or through a dedicated sensor.
Non-contact Geolux LX-80 series level sensors or pressure transducers, such as the Solinst Water Level Temperature Sensor, facilitate monitoring in any environment. Flow rates can be estimated from water level measurement using a stage-discharge relationship.
For more advanced current profiling, side-looking ADCP instruments can also be integrated. This allows for detailed flow calculation via the area-velocity method.
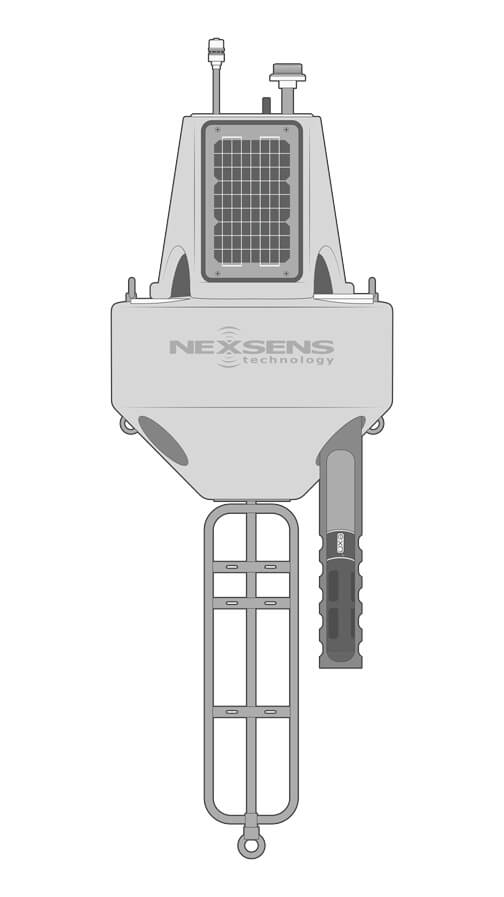
Buoy-based Monitoring
For larger rivers and more flexible sensor placement, buoy platforms are available in a variety of different sizes and power capacities. Buoys support the same data logging electronics and sensor types for water quality measurements.

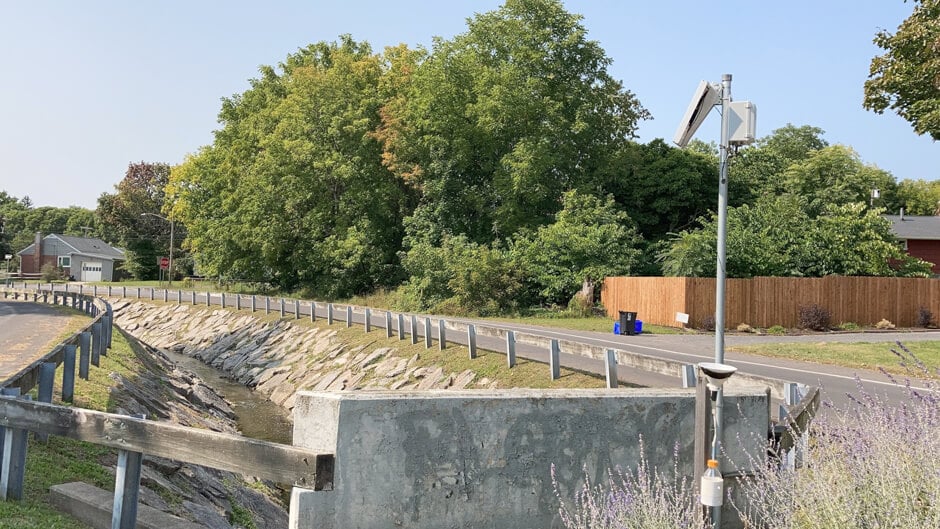
Mounting
Water quality sondes are typically deployed inside a deployment pipe securely mounted on a structure or the bank of the river or stream. Perforation allows water to flow through to the sensors for accurate measurement while minimizing interference from debris.
For mounting X-Series data loggers, the PM2 Data Logger Mounting Kit supports wall mounting with user-supplied hardware or attachment to 1.5″ to 2″ (38 to 50 mm) diameter masts, with grounding hardware to safeguard the system from electrical surges.
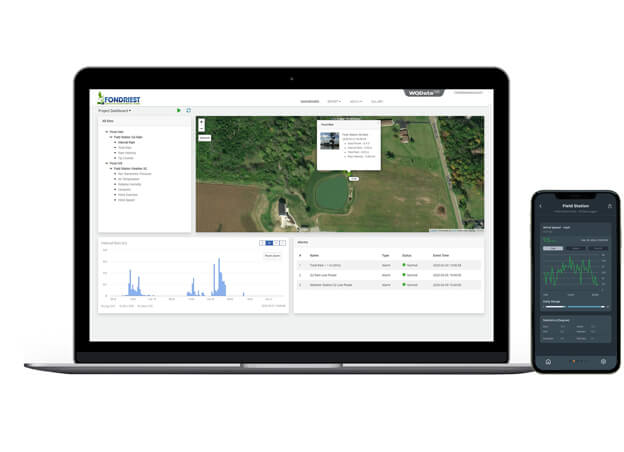
Real-Time Stream and River Data
Wireless 4G LTE, Wi-Fi, or Iridium satellite telemetry options deliver data in near real-time to the WQData LIVE web datacenter.
In a free, basic configuration, WQData LIVE provides secure data access, analysis tools, remote logger controls, simple high/low Quick Alerts, and data sharing through auto-reports.
Subscription-based tiers unlock advanced features, including multi-trigger alarming and automated export, API, and Public Portal options for data sharing.
Purchase in the USA
Visit our US distributor, Fondriest Environmental, to purchase online.
Purchase Internationally
Click the button below to find a local distributor.
Contact a NexSens Applications Scientist
Need help designing an Environmental IoT system? NexSens applications scientists will help you design the perfect monitoring system to meet field conditions and monitoring needs.
Related Videos


Case Studies
Upgrading to Real-Time Systems in Lancaster County
Lancaster County, Pennsylvania, is dominated by agriculture and a developing urban landscape—which result in nutrient-rich runoff that enters into the county’s waterways. Lancaster’s rivers and creeks are part of the larger Susquehanna River Basin and feed into the Chesapeake Bay. While the Lancaster County Conservation District started monitoring the county’s waterways continuously about 5 years ago, the department is making a major upgrade over the next year as they switch from relying entirely on the internal storage of continuous sondes to real-time data loggers. Challenge: Telling the Story of Lancaster Through Data Since the Lancaster County Conservation District started monitoring county waterways, the goal has remained the same, according to Amanda Goldsmith, Watershed Specialist for the Watershed Department.
Monitoring Urban Creeks in Syracuse, New York
Syracuse, New York, is home to a number of urban creeks, ideal for monitoring the influence of human development on water resources. Syracuse University (SU) faculty, staff, and students have been monitoring the city’s waterways for over a decade, with Dr. Laura Lautz establishing a more formal program focused on collecting grab water samples from Meadowbrook Creek for laboratory analysis in 2012. Tao Wen, an Assistant Professor in SU’s Department of Earth and Environmental Sciences, took over the program in 2020 and upgraded it to include 4G modems on continuous monitoring platforms, enabling real-time data viewing. Challenge: Evaluating Urban Land Use with Durable Systems
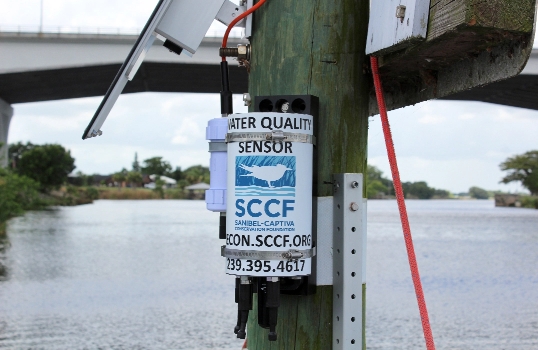
Safeguarding Southwest Florida with Marine Water Quality Monitoring
When the Okeechobee and the Caloosahatchee River were connected by the United States Army Corps of Engineers (USACE) in the 1880s, the region underwent a variety of environmental changes. While water control locks were installed in the 1930s and 1960s, the Sanibel area in Southwest Florida still suffered from deteriorating water quality due to runoff and pollution occurring up the river and surrounding watershed. Incoming nutrient loading caused massive algae drift/stranding events in 2005-2006, according to AJ Martignette, the Laboratory Manager with Sanibel-Captiva Conservation Foundation (SCCF). The water quality shifts also led to the increased frequency and severity of red tides as well as large salinity swings affecting sea grasses in the estuary and freshwater grasses in the river. In order to mitigate some of the damages, the SCCF stepped in to help develop a monitoring program that would help inform the USACE and the South Florida Water Management District when to release water and when to close off the connection between the lake and river. In 2007, what is now referred to as the River, Estuary and Coastal Observing Network, or simply RECON was created. Made up of 11 monitoring sites, the network tracks weather and water quality across Southwest Florida in order to ensure the residents can continue to rely on the aquatic system. Challenge: Environmental Conditions in Southwest Florida