
 The University of Akron Field Station is located on the 411-acre Bath Nature Preserve in northeastern Ohio. It promotes a better understanding of our relationship with the natural environment through research, education, and service.
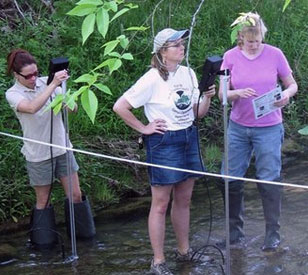
Students, faculty, and Bath community members have been working for some time to gather long-term, baseline data on water quality, biological diversity, and climate of the preserve. Project administrators have chosen to use the NexSens WQData web datacenter as a solution to help manage this long-term data.
In addition, Dr. Jessica Hopkins from the University of Akron has spearheaded a project to set up four real-time water quality and stream flow monitoring sites within the nature preserve. WQData allows researchers to compare this real-time data with historical data on a single, web-based user interface. This valuable information will improve monitoring capacities within the Cuyahoga Valley watershed and provide a better understanding of the overall environment.
Eyes on the preserve
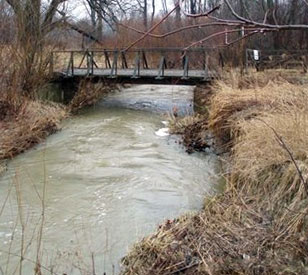
 Four real-time water quality and stream flow sites are located within the Bath Nature Preserve. These sites feature YSI multi-parameter sondes that measure water temperature, dissolved oxygen, conductivity, pH, and turbidity. NexSens AccuStage vented level sensors measure water level, and LI-COR pyranometers measure solar radiation.
Water flow (or discharge) measurements are taken over time using a SonTek FlowTracker. This data is combined with water level readings taken by the NexSens AccuStage pressure sensor to create a stage-discharge relationship. The stage-discharge curve allows the user to determine the approximate flow rate from the water level data.
Data is collected using NexSens iSIC (Intelligent Sensor Interface and Control) data loggers that feature spread-spectrum radio telemetry. The data is transmitted wirelessly to a base station consisting of a PC running NexSens iChart software. iChart interprets the data and automatically posts it online to WQData.
WQData provides an online interface for viewing environmental data. It offers 24/7 instant access using any web browser. Specifically designed for environmental monitoring applications, it is easy to set up and maintain. The datacenter can be set up as a secure (password-protected) or an open site for easy access by anyone with the Web address.
With this web-enabled datacenter, students and faculty from the University of Akron can see measurements on a virtual instrument panel; they select panel buttons to view project area maps, recent and historical data, time series graphs, statistical summaries, and project-specific information.
Equipment
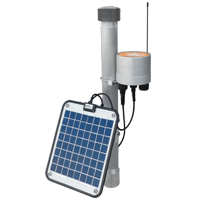
The NexSens X2 Environmental Data Logger offers the latest in real-time monitoring technology with wireless communication, large plug-and-play sensor library, and ultra-low power consumption.
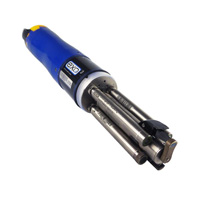
EXO3 is a purpose-built sonde for monitoring major water quality parameters, including: pH, conductivity, temperature, turbidity and dissolved oxygen.
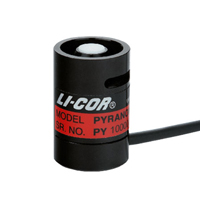
The LI‑200R Pyranometer measures total solar radiation. In outdoor sky conditions, the LI‑200R performs comparably to first-class thermopile pyranometers.
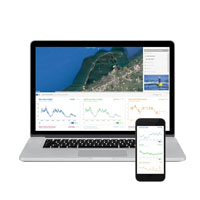
WQData LIVE is a web-based project management service that allows users 24/7 instant access to data collected from remote telemetry systems.